The Two Ten-Percents
In this post from the book NET-ZERO:
Why are you lucky to be average? The skewed distribution of incomes and wealth.
What are the two ten-percents? For each person earning over $16,000 per year in the richest top 10% of the world there is someone stuck in the bottom 10% earning less than $1,000 per year.
How will emissions grow with population and a rising standard of living? If we make no further effort to decarbonise the economy then emissions could double to over 100 billion tonnes per year.
The Privilege of being Average
The industrial revolution over the last two centuries has for the first time in human history created increases to not only population but also to prosperity. An improved quality of life has come for many, but not for all, and there remains huge inequality across the world.
Average incomes may have risen 18 fold, but three quarters of the world earns less than the average (with the remaining quarter earning significantly more) and 10% of people are still stuck in a poverty trap earning less than $1,000 per year. The distribution of prosperity is heavily skewed.
The statistician who sleeps with his head in the oven and feet in the freezer may be the perfect average temperature but clearly averages don’t tell the full story.
A significant proportion of the World’s population still spends most of their time labouring in the field, earning little income, and isolated from the energy surpluses of the modern world. For many, life expectancies are short and child mortality rates high due to poor diet and lack of access to medicines and professional healthcare. Income inequality, corruption, and crime are prevalent. Education, basic human rights, and self-reported life satisfaction are low.

GDP per capita on the horizontal axes using a logarithmic scale versus percentage working in agriculture from Our World in Data. The size of each bubble represents the population of the country in question, not all countries labelled.

GDP per capita on the horizontal axes using a logarithmic scale versus vertical axis average years spent in formal education from Our World in Data. The size of each bubble represents the population of the country in question, not all countries labelled.

GDP per capita on the horizontal axes using a logarithmic scale versus vertical axis life expectancy at birth from Our World in Data. The size of each bubble represents the population of the country in question, not all countries labelled.

GDP per capita on the horizontal axes using a logarithmic scale versus vertical axis percent of children that die before the age of five from Our World in Data. The size of each bubble represents the population of the country in question, not all countries labelled.
The Two Ten Percents
Hans Rosling, in his book Factfulness, breaks down the global population into four income levels: if you have enough leisure time to be reading this blog, you are probably in the top 10%. You most likely earn over $16,000 per year, you went to school, drive a car, have access to electricity, hot running water, and you eat pretty much whatever you want.
But for every person in the top 10% there is someone in the bottom 10% who consumes the equivalent of less than $1,000 per year and remains stuck in a poverty trap.
Work is done by hand and you travel by foot. Your small plot of land must provide enough food for you and your family. Most of your time is spent in the field or walking to the nearest well as you have no access to safe water or sanitation. You cook and heat your house on an open stove which makes it difficult to breath. You hope that you or your family don’t get ill as you have no income to afford medication. Everything you produce is required to sustain your family with nothing left over to invest in farm equipment or basic amenities which could make life easier, more productive, and help break free of the poverty trap. You are largely isolated from the modern world.
The remaining 80% of the global population fall somewhere in-between but importantly are on the path towards the top 10%. Faster transportation, better sanitation, more nutritious diets, and clean cooking and heating leads to better health, growing wealth, and a virtuous circle of increasing productivity.
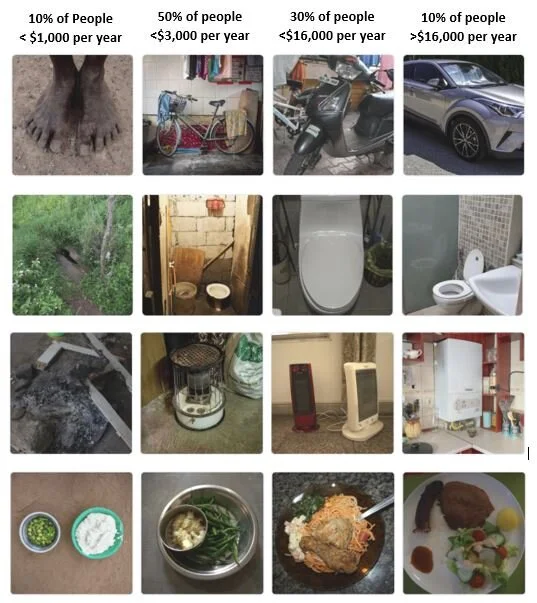
Images courtesy of $Dollar Street, Gapminder.org. Annual income bands estimated based on “The future of Worldwide Income Distribution” Note: income per capita is slightly less than average GDP per capita (USD 12,000, USD 18,000 purchase parity) quoted elsewhere because of depreciation, cash retained by companies, certain government spending and under reporting on tax returns. Amount quoted in 2011 USD purchase price parity including the value of self-production and consumption (eg food growing).
Improving on Average
As the majority of the population rightfully strive for a better quality of life so global consumption will increase. More miles travelled, food eaten, and products made. But what strain will this exert on the planet, society, and the economy?
Let’s map out a simple scenario. This scenario is not a forecast, it’s not based on current market trends or where the world is heading, it simply assumes that the future is a bigger version of the present. A benchmark for where the world would be if we decided to make no further effort to change our energy or agricultural systems. A baseline of inaction in a growing world.
Let’s assume the global population increases by 30% from 7.8 billion to a peak of 10 billion people by the year 2060 (broadly in line with United Nations projections). Let’s also assume the average level of physical consumption increases to developed market standards throughout the world over the same period.
A world where everyone has a top 10% standard of living. Where the 0.8 billion people with no electricity access, 2.5 billion people with no clean cooking solutions or sanitation, and the 4 billion people with no running water, are brought up to modern standards.
In the Transport sector, miles travelled by passengers double on land and triple by air. Across industry, we budget for 12 tonnes of industrial production per person per year (from 8 tonnes today). Basic amenities are provided for everyone on the planet, including access to space heating or cooling for anyone who needs it, electricity access, clean cooking, and hot water for all - enough energy to deliver a top 10% level of consumption in sanitation, light, appliances, and cooking for each person on the planet. Agricultural output grows with population, production yields increase at a similar ongoing rate, and no change is made to diet or agricultural practices.

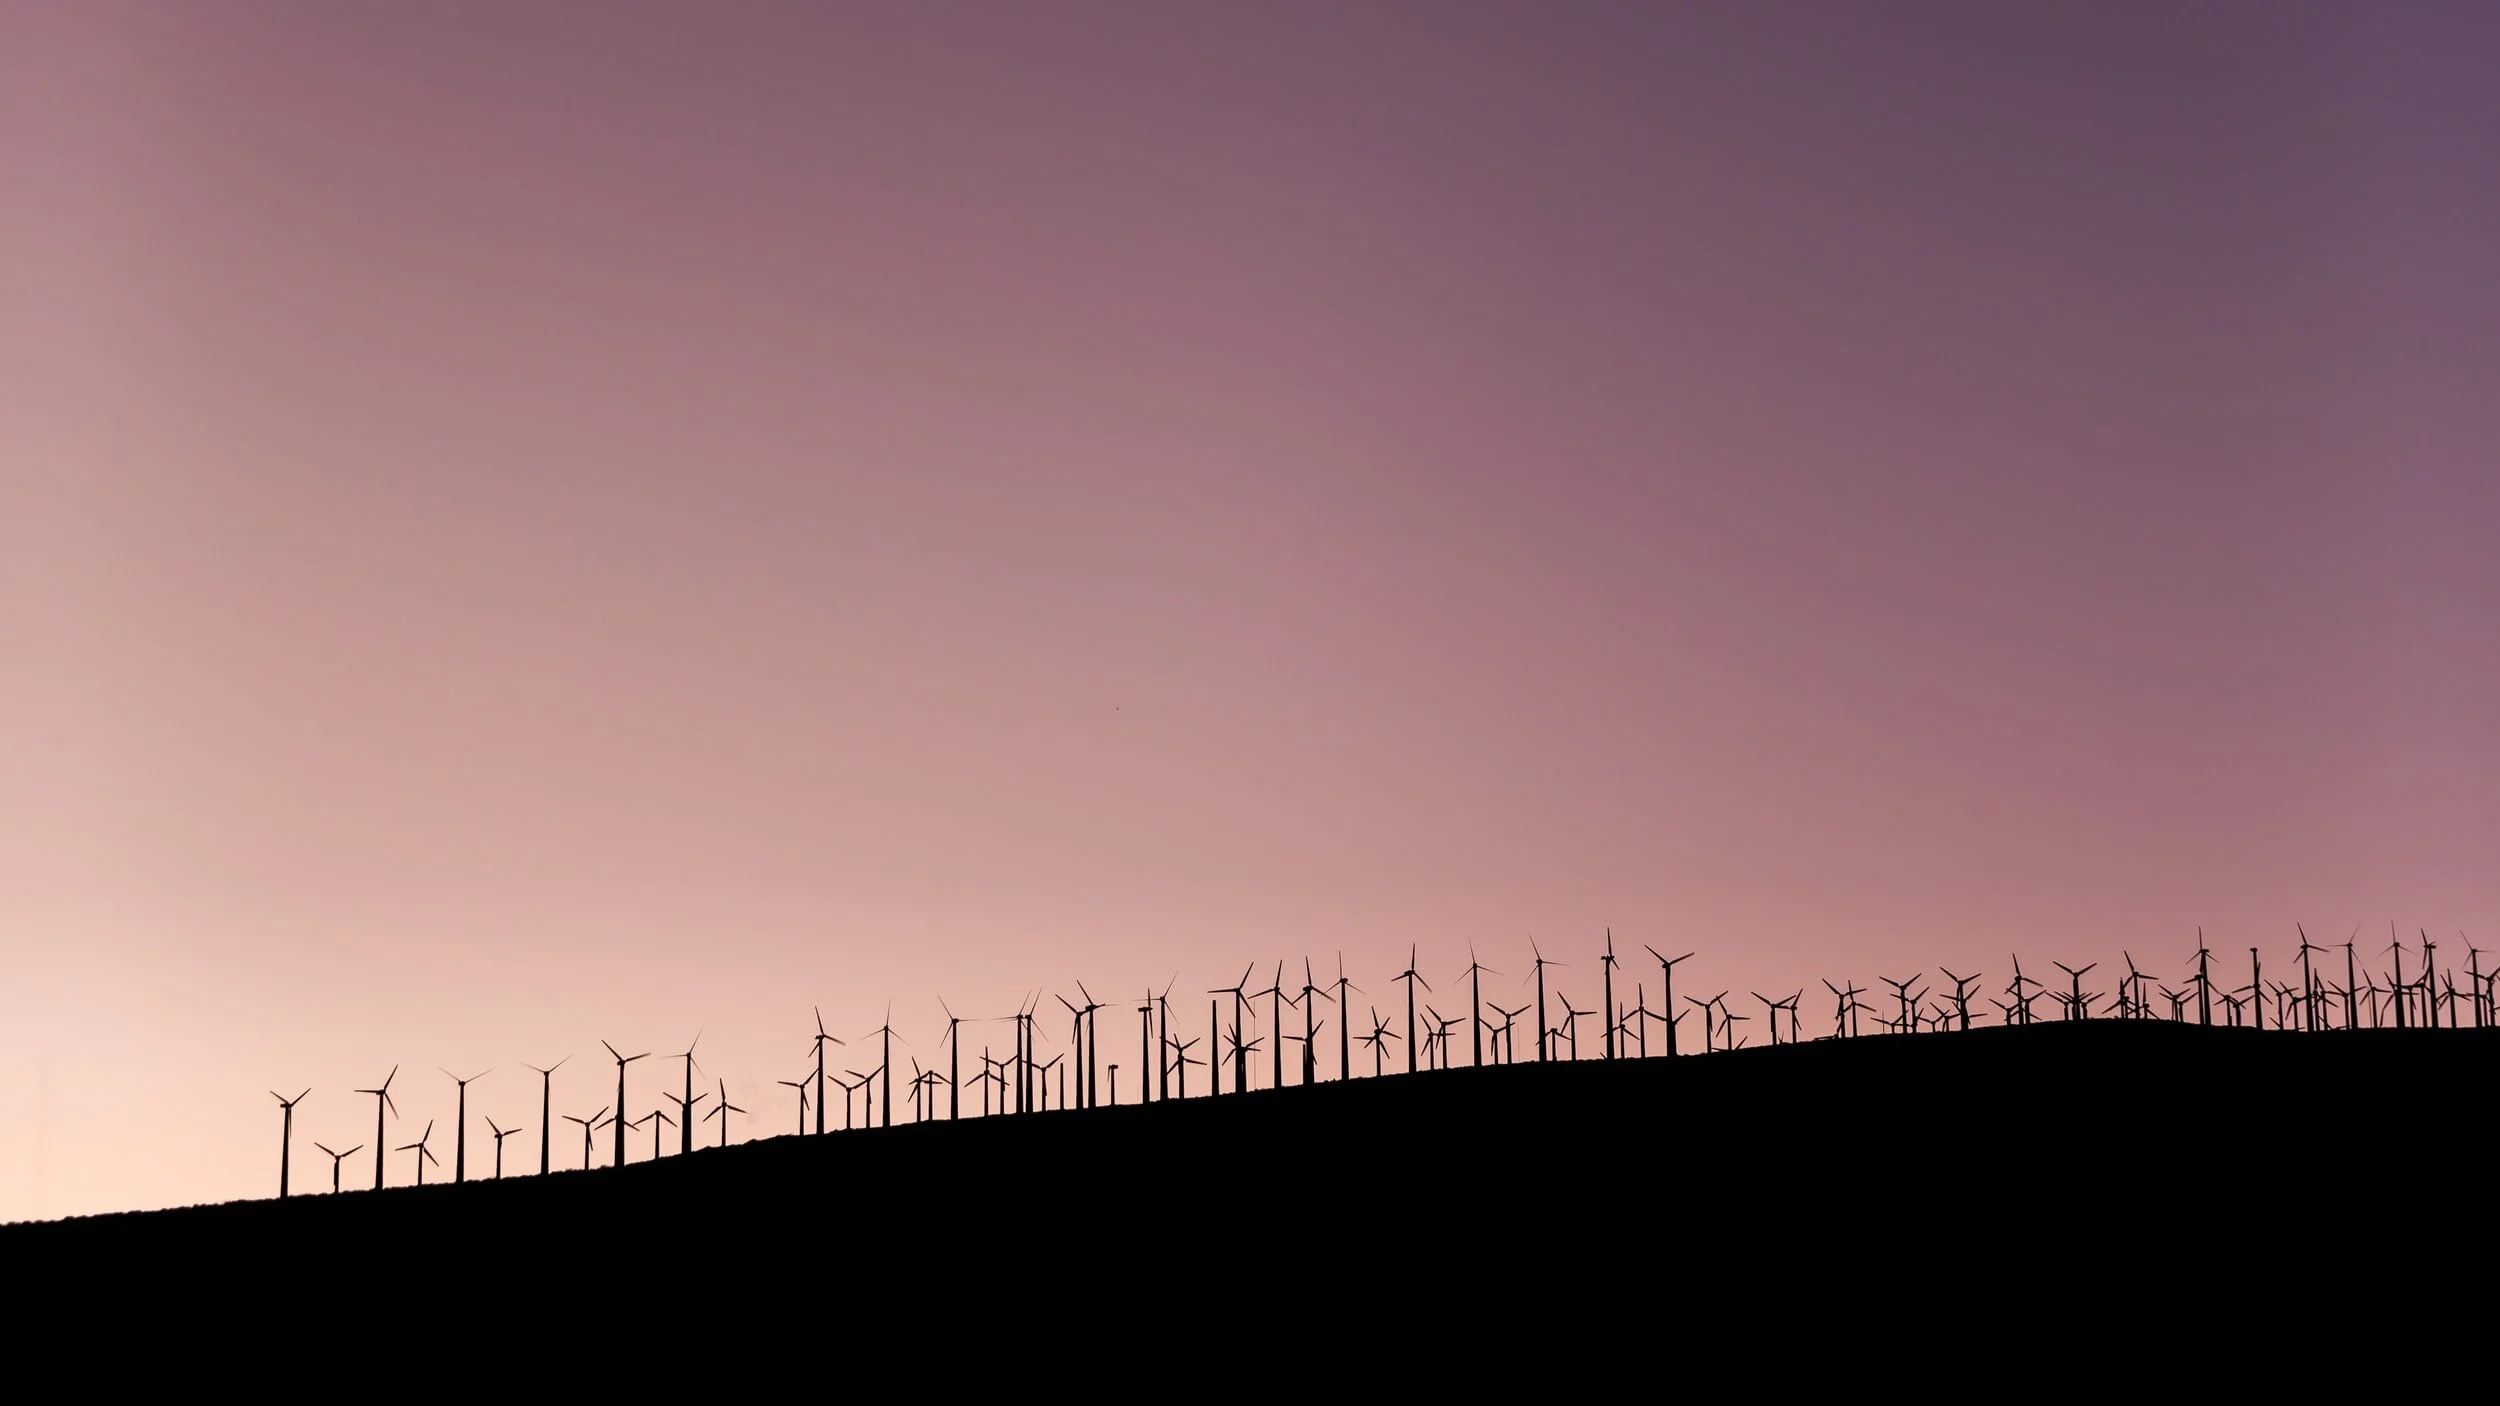
The division of wealth. Unsplash (Jason Sung)
To fuel this increased consumption whilst assuming no change to the makeup of the existing energy system, then the total final energy demand doubles to 200,000 billion kWh per year, and CO2e emissions will rise from 50 to over 100 billion tonnes per year by 2060. Beyond this, let’s assume the population, consumption, and carbon intensity remains the same and emissions hold at 100 billion tonnes per year.
In this baseline inaction scenario, the world would emit 7,000 billion tonnes of CO2e over the next 80 years, atmospheric concentrations of greenhouse gasses would double by 2100 (from today), with an accompanying temperature rise of over 3C by the end of this century and up to 5C warming locked-in as Earth’s systems play catch up.
This unprecedented change to Earth’s systems could lead to ~15 million deaths per year, ongoing suffering and hardship for over one-third of the global population, and 5-9% of global GDP wiped out by the start of the next century (the equivalent of 4.5% of global welfare lost forever). It also risks crossing thresholds or tipping points in Earth’s physical systems, which could create amplifying feedback, which accelerates change even faster risking further damage to socio-economic systems and the environment.
So how do we walk a softer path whilst creating a better average quality of life for all?
I believe a rapid transition to net-zero can solve both air pollution and climate change whilst accelerating increases to underlying wealth, health, and human progress. Net-zero will be cheaper, cleaner, safer, more reliable, more sustainable, and will create more employment than if we remain bound to fossil fuels.
By understanding and acting on this statement we can redefine the argument and create a better future for all on Planet Earth.